In my last blog post I have shown how we estimated the Anglo-Saxon genetic contribution to modern English from rare variants. Here I’ll show more generally how we can use rare genetic variants to learn more details about population history.
As a motivation, consider this figure from the 1000 Genomes paper:
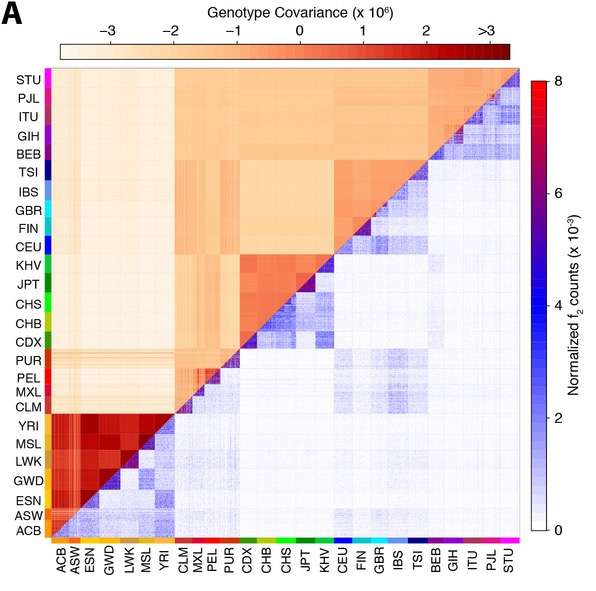
The lower right half of this figure shows doubleton sharing counts between all 2,504 individuals in the study. A doubleton is a mutation that is only seen exactly twice in the entire data set. There are millions of those between any two people, but they occur a lot more often between individuals within the same population, or even within the same subpopulation. In particular compared with the upper left triangle, which shows the genome-similarity of a pair of individuals, the number of doubletons shows a much finer resolution.
For example, in the case of the GBR population (Great Britain), and the CHS population (Southern Han Chinese), a sub-population level clustering is visible in the doubleton allele sharing counts as three small distinct triangles seen in the plot, revealing three distinct sampling locations in these cohorts. But one can also see cross-population connections, e.g. between CEU and GBR (which have very similar genetic ancestry), and between Native Americans (PEL, PUR, MXL and CLM) and Spanish (IBS), which points to recent European admixture in the Americas.
So apparently, rare genetic mutations indicate fine-scale population structure, much more so than common variants. In fact, the example above only shows doubletons; there are many mutations of higher — but still low — allele frequency which are not only shared among pairs of individuals, but among three or more samples. We cannot easily visualise their counts in a matrix anymore, but to give an idea, here is a list with rare allele sharing counts in just four populations (here Finnish, British, Spanish, Italian, each with about a hundred individuals) up to allele count 3:
PATTERN   COUNT
(0,0,1,0) 2729828
(0,0,0,1) 2493367
(0,1,0,0) 1368389
(1,0,0,0) 931505
(0,0,2,0) 271082
(0,0,1,1) 256098
(0,0,0,2) 246545
(2,0,0,0) 177262
(0,1,1,0) 140255
(0,1,0,1) 116360
(0,2,0,0) 101485
(3,0,0,0) 74200
(1,0,1,0) 63762
(1,0,0,1) 62110
(1,1,0,0) 60916
(0,0,2,1) 59929
(0,0,1,2) 54368
(0,0,3,0) 51519
(0,0,0,3) 38511
(0,1,1,1) 34817
(0,1,2,0) 28842
(0,1,0,2) 22983
(0,2,1,0) 18414
(1,0,1,1) 15654
(0,2,0,1) 15342
(2,1,0,0) 13555
(2,0,1,0) 13177
(1,1,1,0) 13157
(2,0,0,1) 12512
(1,1,0,1) 12199
(1,0,0,2) 11721
(0,3,0,0) 11183
(1,0,2,0) 10868
(1,2,0,0) 8997
Each row has first the pattern of rare mutations in the four populations (for example, a pattern of (1,0,1,1) means that there is one observed mutation in each of the Finnish, Spanish and Italian individuals and none in the British), and then the number of times that this pattern is observed in the genome. One can see how the complexity of this joint site frequency spectrum increases dramatically with the number of populations considered and the maximal allele count (here only 3, out of hundreds of samples).
Even without modelling, just by looking at the histogram above, there are a number of qualitative observations we can make. For example, the Finnish population has the lowest* amount of singletons compared to the other three populations (931505 compared to 2729828, 2493367 and 1368389), which suggests a lower effective population size caused for example by a strong bottleneck in the population history of the Fins. At the same time, of all private variants with allele count 3, the Finnish have the largest* number compared to the other populations: 74200 in Finnish, compared to 51519, 38511 and 11183 in Spanish, Italian and British samples, respectively. This excess of tripletons while showing a relatively low number of singletons is the signature of a population contraction combined with isolation, consistent with a recent bottleneck scenario in Finnish population history (there must have been an expansion after the bottleneck, but that was so recent that it has not yet left a strong enough trace in singletons at this resolution). Other observations from this table include the relatively high degree of allele sharing between Spanish and Italians at allele counts 2 and 3. This suggests that these two populations are relatively closely related to each other.
One way to explain this pattern of shared variation is via an explicit population model. We can for example use computer simulations to simulate many different scenarios of population split times and population sizes and see which scenario most closely matches the truth. This is the approach taken by other methods, but it does not scale with so many individuals as considered here. Moreover, we have found that even only considering rare variants up to allele count 4, should have enough power to infer population history, but standard simulation tools always generate all mutations, including common variants, which is computationally wasteful.
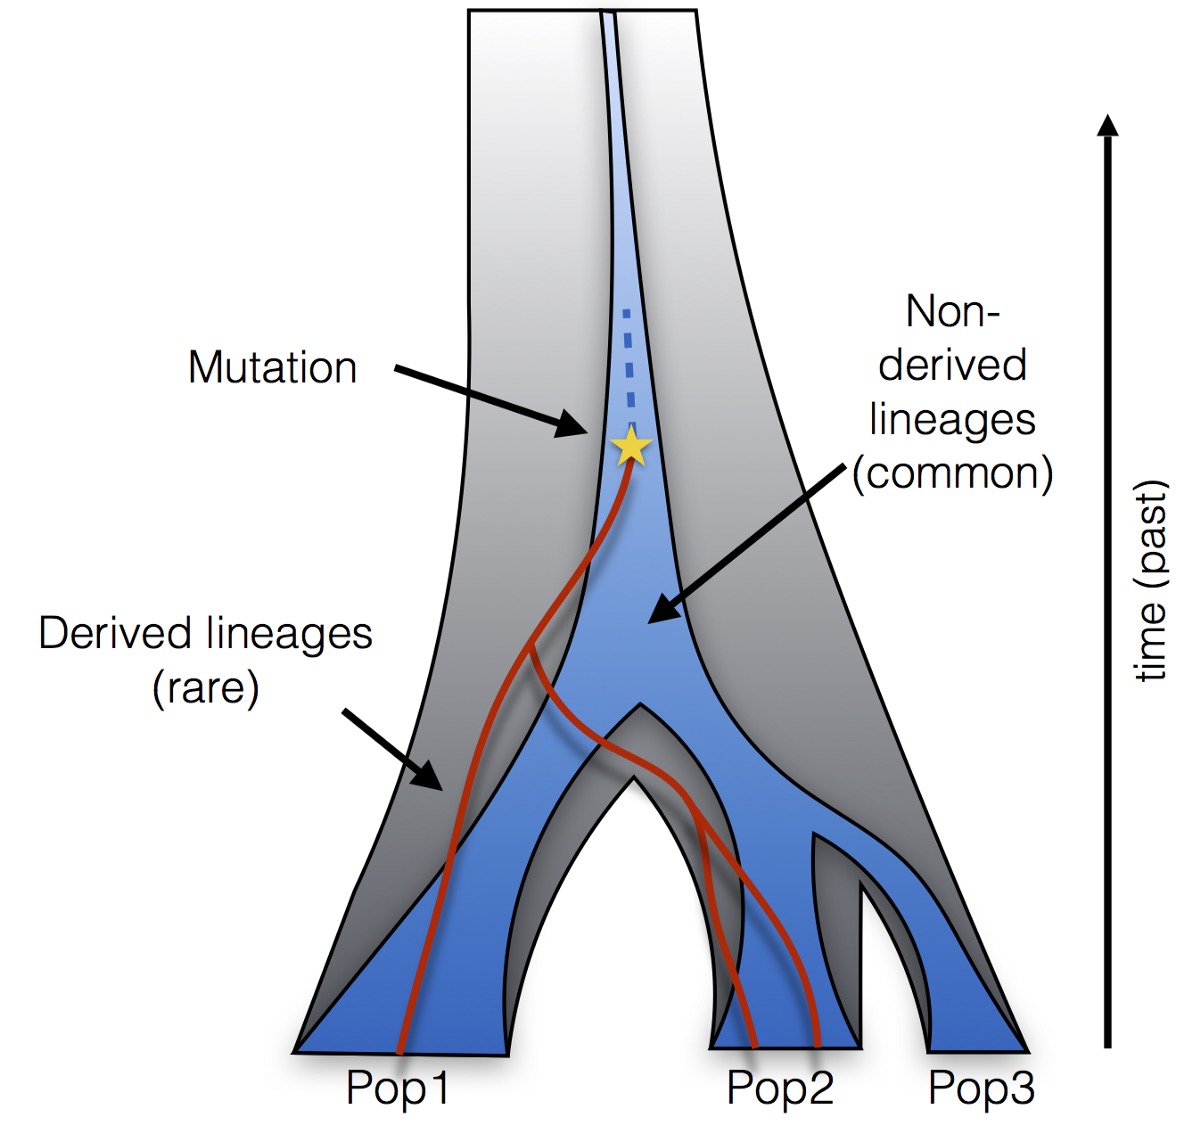
Here is where rarecoal comes in. Rarecoal stands for “Rare Allele Coalescent” and is a method to efficiently compute the likelihood of rare sharing patterns under an explicit population model. The key objective with this method is to compute the expected frequency* *of rare mutation patterns under a given demographic model. To estimate this frequency (an entry of the joint site frequency spectrum), rarecoal uses coalescent theory to reconstruct all possible genealogies in which rare alleles with a particular observed pattern can be connected with each other.
All these possible genealogies connecting rare alleles have a particular property: Their lineages (here shown in red) must all derive from a common ancestor on which the rare mutation occured. Moreover, this common ancestor has a common ancestor with all other lineages (in blue) that is older than the time of the mutation. Any more recent common ancestor between a derived and a non-derived lineage would require a secondary mutation, which is so unlikely that it is usually excluded (according to the so-called infinite sites model in coalescent theory).
It turns out that this condition (all red lineages must have a recent common ancestor, and that ancestor merges with other lineages at an older time than the mutation), and some approximations of the coalescent process, are enough to compute the frequency of any observed pattern of rare mutations very efficiently. Since this calculation depends on the specifics of the population model (split times, population sizes and migration rates), we can effectively compute the likelihood of a model given the data. We can then computationally find the model whose predicted rare allele frequencies best match the observed ones, among some family of analysed models.
This model estimation process works remarkably well for simulated data:
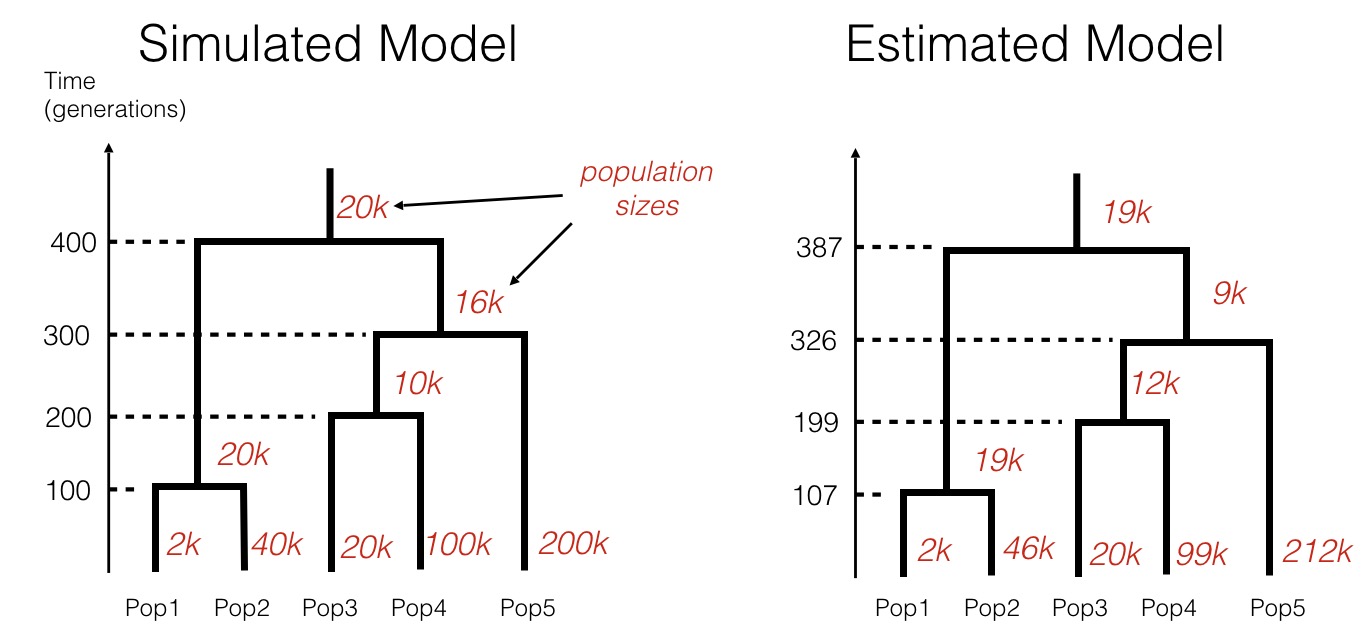
In this simulation, we generated counts of shared rare mutations, very similarly to the table shown above, given a specific population history (shown on the left). We then forget the history and use only the data (counts of rare alleles) to infer the most likely tree-like population model using rarecoal. As can be seen, the inferred model closely matches the simulated model, demonstrating the power of the approach.
Finally, we applied our method to the large genomic data set presented in the Figure and table above, and asked rarecoal to estimate a maximum likelihood population history model based on rare mutations in this data set. Here is what we found:
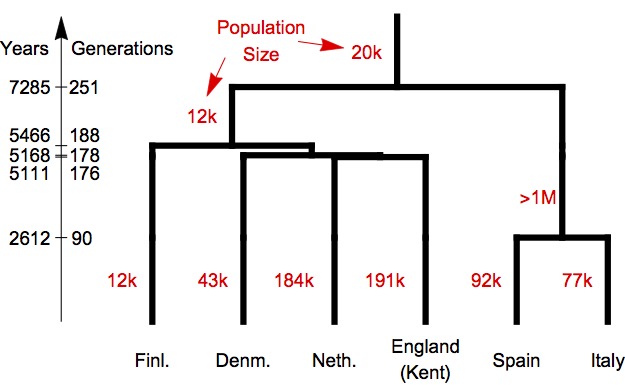
First, as we expected from visual inspection of the joint site frequency spectrum for four of these six populations, the Finnish population has by far the lowest inferred population size compared to the others. Also, the deepest split in this tree is between North and Southern European populations. Other notable aspects are a very large ancestral population size in the branch leading the Southern European populations, and a close relationship between Netherlands and South England, presumably associated with the Anglo-Saxon migrations (when we replace the population from Kent with a sample from Cornwall, we find that the Cornwall population splits first off the Northern European clade).
This was just a short demonstration on how rarecoal works and what it can do. Since the initial publication, I have extended the framework considerably, allowing now to test not only models varying by population sizes and split times, but also by migration edges. The newly inferred models are more of an admixture graph than a tree, which is more appropriate for human history than tree-models. We are preparing a publication using these new approaches, and there will also be a blog post covering these new developments soon.